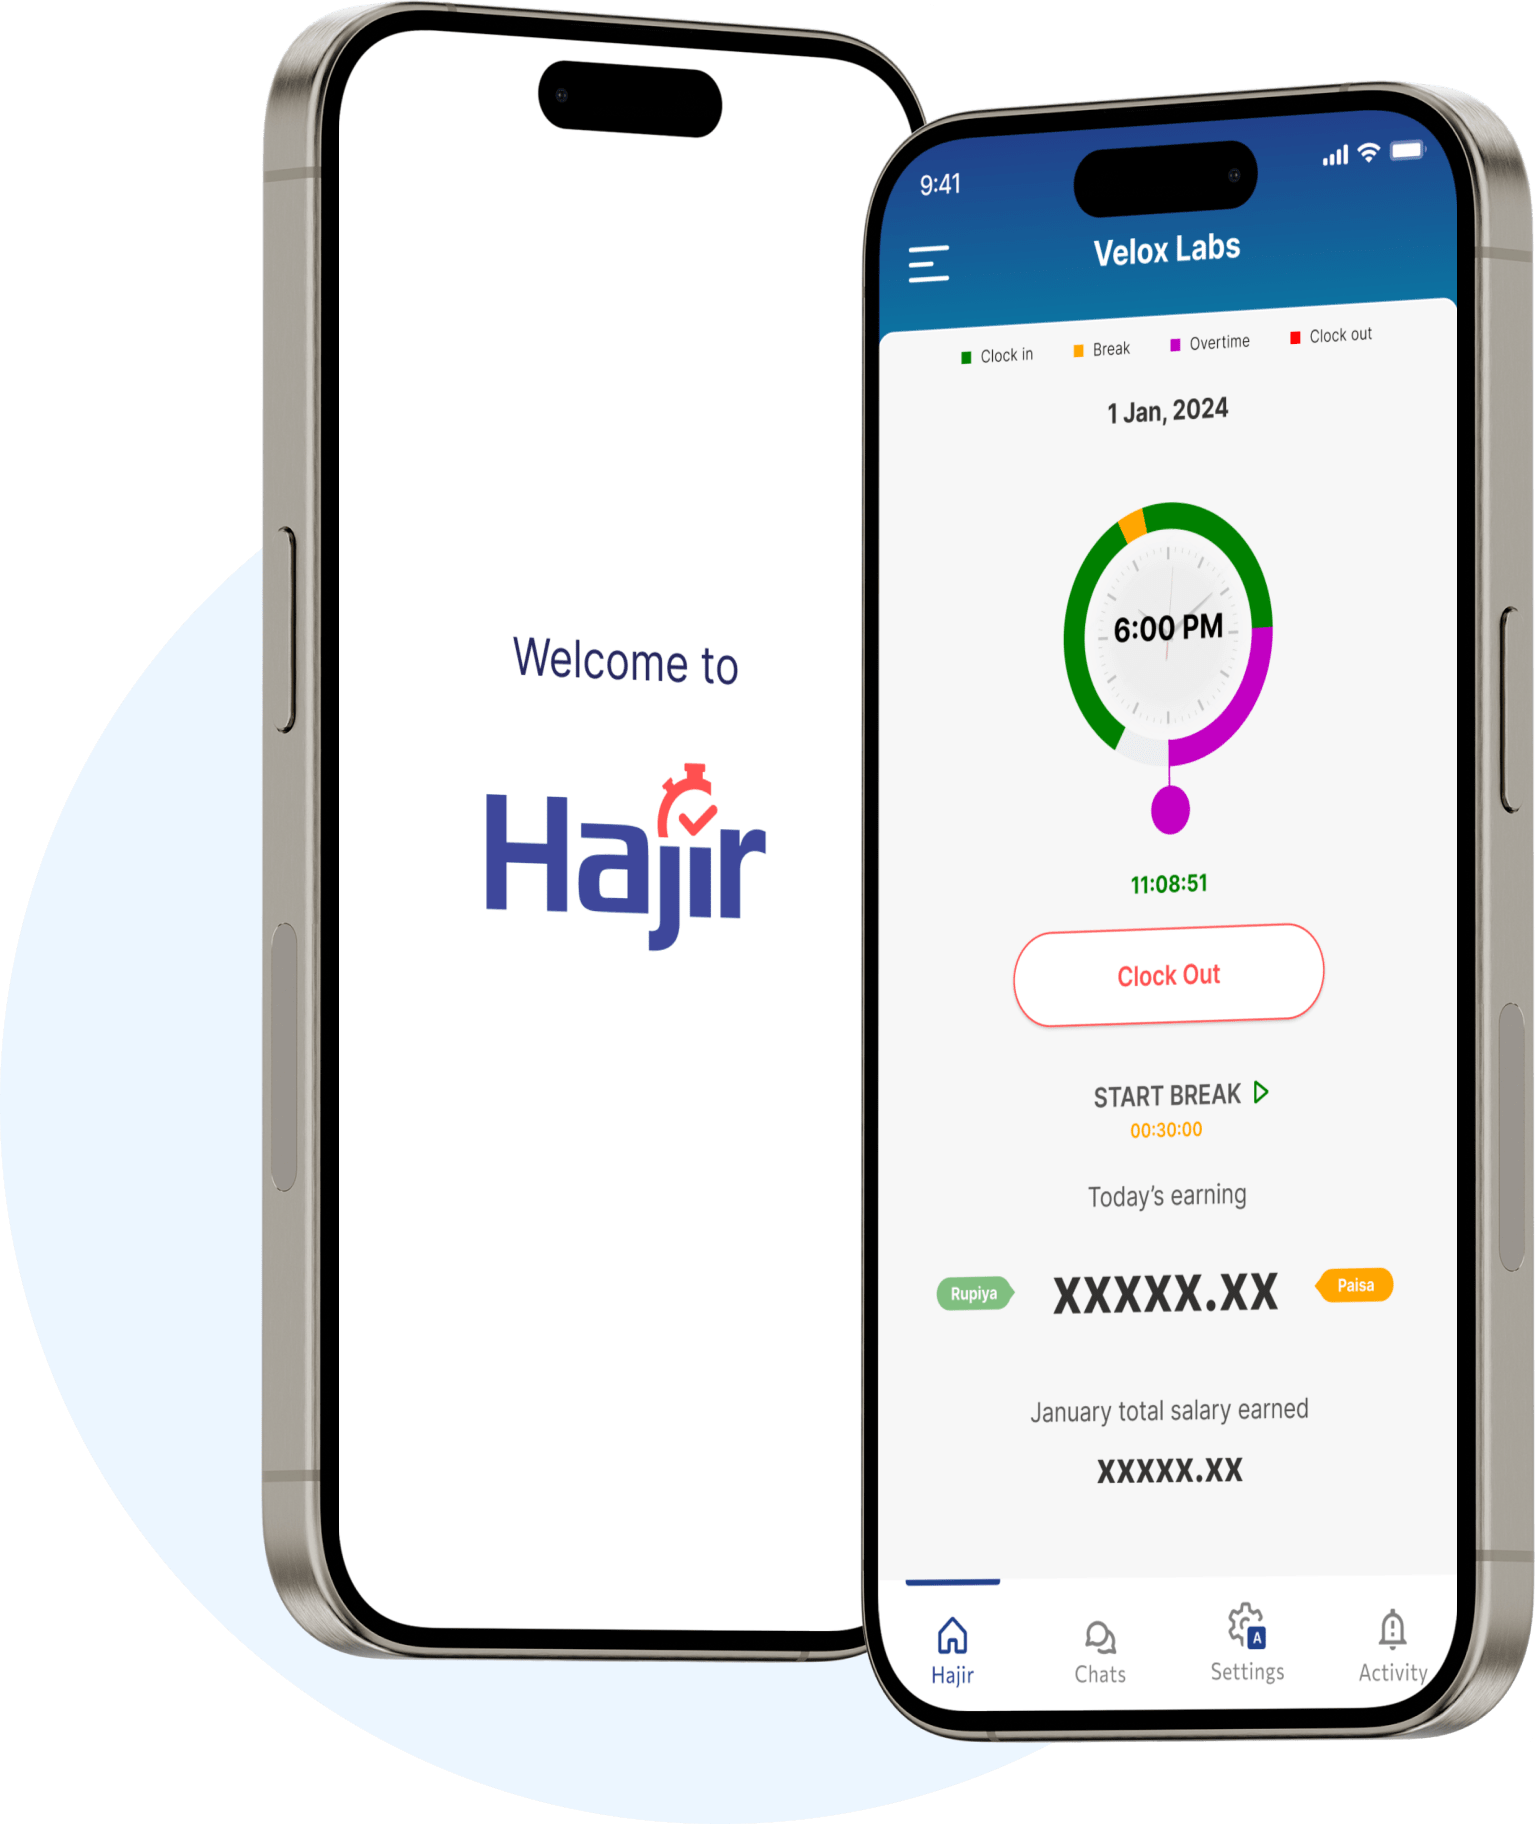
Dynamic Reports Generation
Dynamic Reports Generation allows generating reports from the raw data of your organization in real time. Analyzing module-wise and graphical reports can extract key metrics and customizable reports accurately. Hajir’s robust reports enhance operational analytics and reduce manual interventions, improving visibility across the organization for better decision-making.
Fast Onboarding
Secure Cloud-Based
Employee Self-Service

Our Reach
Trusted HR Solution for Every Industry
Across sectors like education, healthcare, technology, and hospitality, Hajir transforms
HR management, making it simple, efficient, and employee-friendly.
Information Technology
100+
Manufacturing
40+
Finance
35+
Hospitality
150+
Healthcare
65+
Education
250+
Retail
125+
Logistics
55+
Cooperative
175+
Consultancies
100+
Construction
25+
Automotive
20+
Securities/ Broker
5+
NGOs
10+
Beauty & Cosmetics
5+
Importer & Dealer
15+
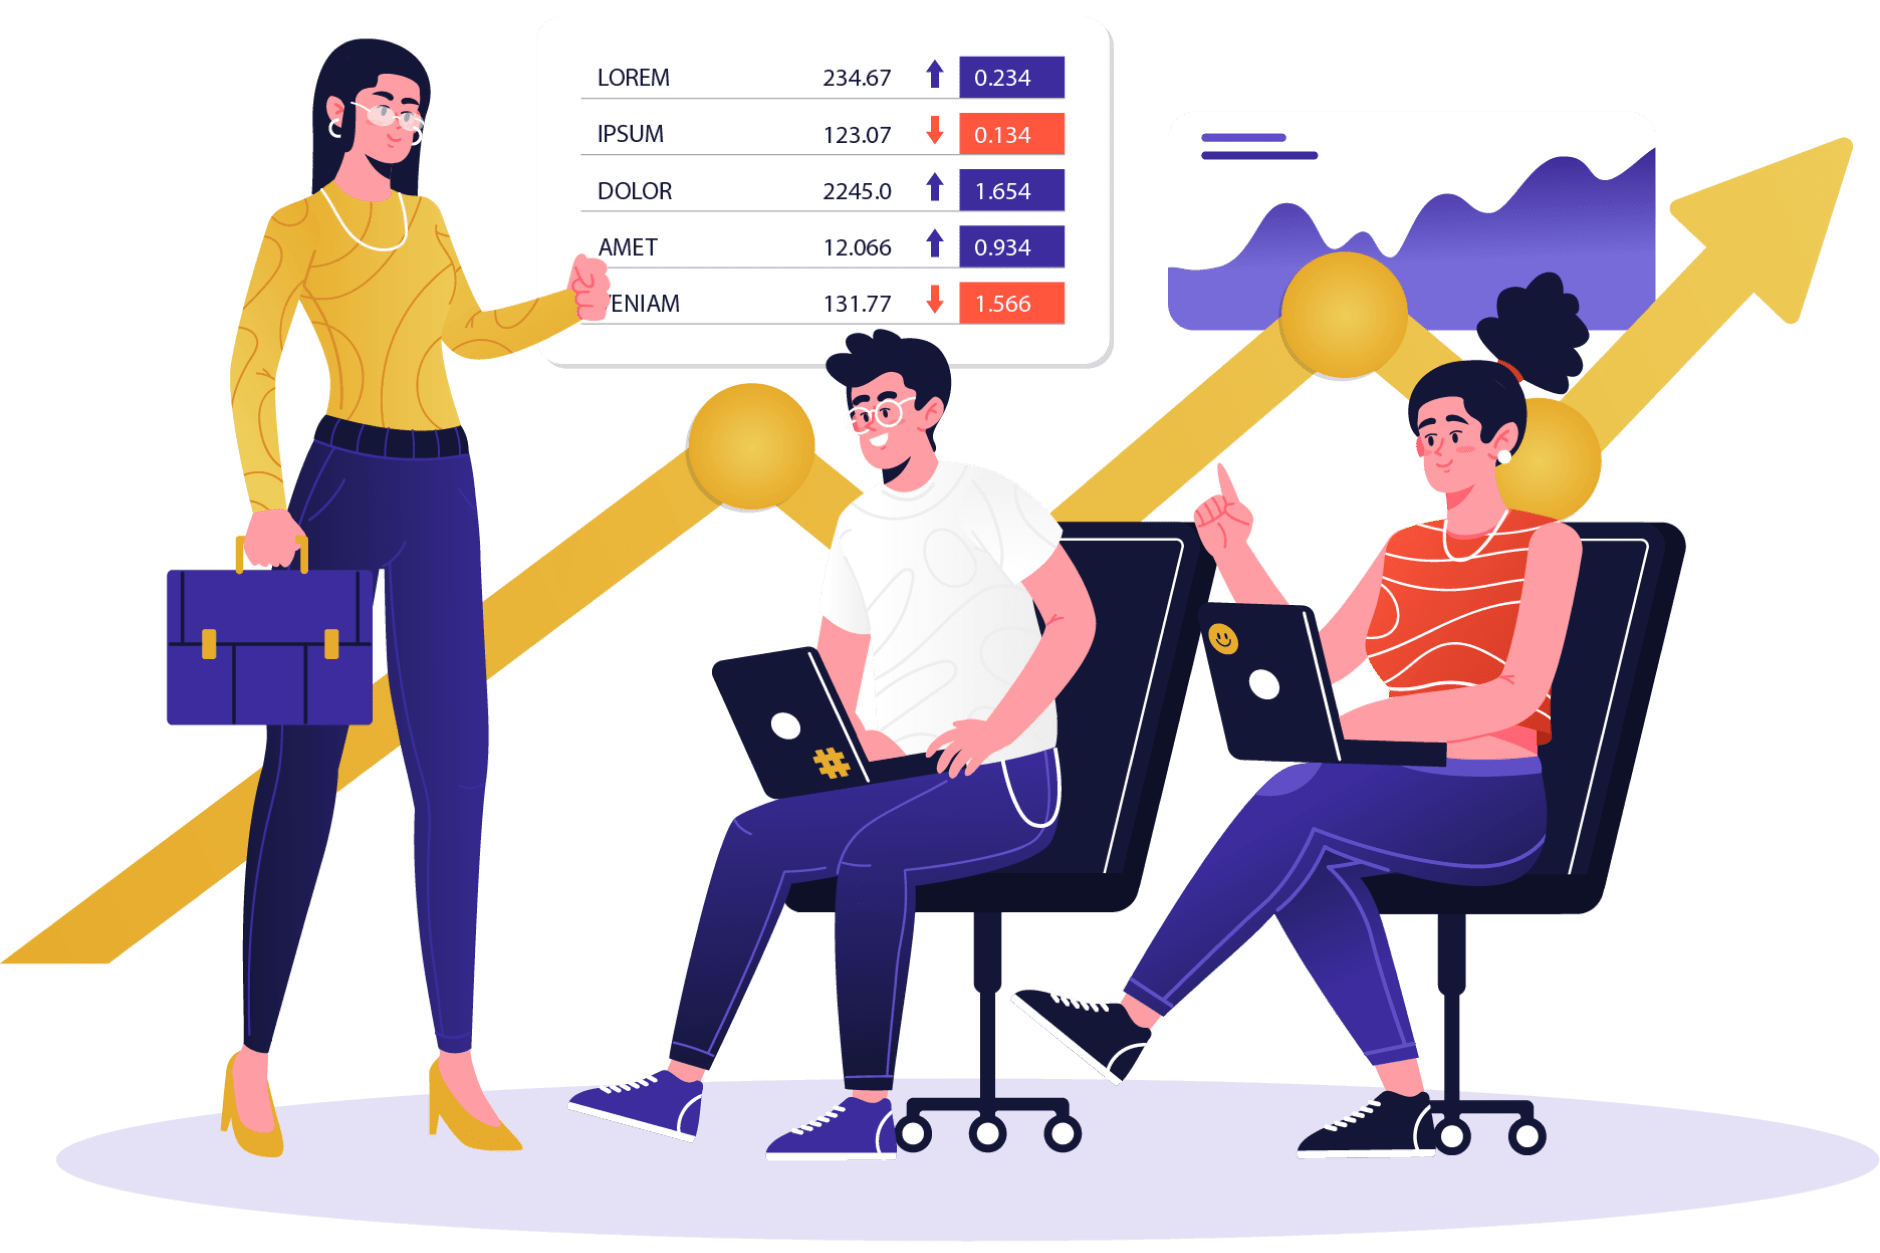
Turn Data into Action with Dynamic Reports.
A dynamic solution that tracks trends, monitors KPIs, and shares data for analytics. Change how you measure your actions and staff’s productivity to make better and faster decisions.
Custom Filters & Export Functionality.
Filter your results by team, system users, date, and task performed type. This data can also be exported in the required formats.
Real-Time Visual Dashboards.
Transform your raw data into quality visuals that help understand trends and performance at a glance.
Scheduled Report Delivery.
Inter-team report sharing can be automated at a set interval of time.

Advanced Reporting Filters
Find insights through custom reports by using filters like department, designation, duration, or activity type. Researchers can examine a newly discovered locality of the data set with the help of filters. This could eventually lead to creating separate analyses and reports.
Visual Performance Metrics
In addition to the simple data analytics, visually stunning graphics are presented in the form of advanced charts or graphs. This allows for higher-level interpretative evaluation of a department’s performance and productivity trends along with the identification of improvement areas and the tracking of KPIs in less complicated ways.

Ready to get started?
Request for demo today!

Automated Reporting Cadence
Manual report creation can be automated easily with predefined delivery schedules. The reports can be scheduled for daily, weekly, or monthly delivery so that crucial information is easily accessible to relevant stakeholders and no further action is required on their side, thus increasing the team’s workflow and efficiency.
Role-Specific Access Control
Regulating document access according to clearly defined user classes helps ensure that sensitive or confidential information remains secure and private. This structured method enhances information control while still allowing appropriate levels of access necessary to effectively monitor, manage, and support the needs of different department within the organization.

Integrated Data Modules
Access to current information from different modules into a single report that consolidates stakeholders’ perspectives regarding the issues and operations enables inclusion and improved decision-making. This consolidated information enhances performance monitoring, accelerates the early detection of inefficiencies, and improves forecasting and strategic planning accuracy throughout different departments.
Download the App and Get Started